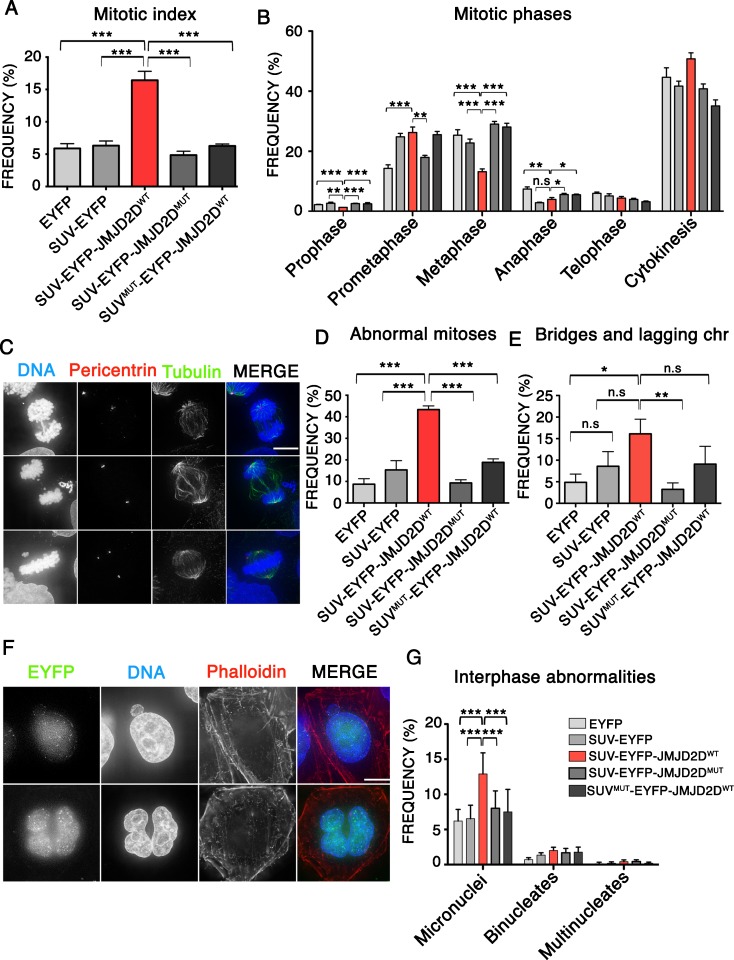
Fig. 2.
Heterochromatin removal disrupts mitosis and chromosome segregation. a Analysis of the frequency of mitotic cells after expressing the indicated SUV39H1ΔSET-EYFP fusion proteins. Data represent the mean and standard error of the mean (s.e.m) of five independent experiments. b Analysis of the frequency of every individual mitotic phase in relation of the total number of mitoses. Data represents the mean and the standard error of the mean (s.e.m) of six independent experiments. c Representative IF images showing mitotic abnormalities in HeLa cells. Images show examples of chromosome bridges (top), lagging chromosomes (middle) and uncongressed chromosomes (bottom). d Analysis of the frequency of abnormal mitoses after expressing the indicated SUV39H1ΔSET-EYFP fusion proteins. Data represent the mean and standard error of the mean (s.e.m) of four independent experiments. e Analysis of the frequency of mitotic cells showing bridges or lagging chromosomes after expression of the indicated SUV39H1ΔSET-EYFP fusion proteins. Data represent the mean and standard error of the mean (s.e.m) of four independent experiments. f Representative IF images showing interphase abnormalities in HeLa cells. Images show a cell with micronucleus (top), and a binucleate cell (bottom). g Quantification of interphase abnormalities after expressing the indicated SUV39H1ΔSET-EYFP fusion proteins. Data represent the mean and standard error of the mean (s.e.m) of three independent experiments. Asterisks indicate statistical significant differences compared to EYFP (*P < 0.05, **P < 0.01, ***P < 0.001; Student’s t test)

