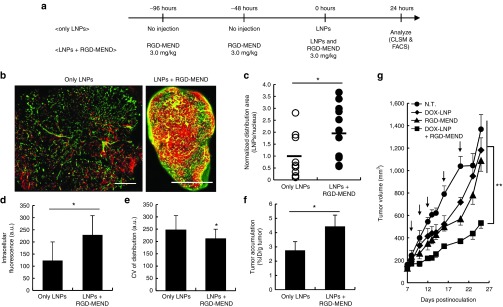
Figure 1.
Improvement in the subsequent distribution of LNPs' and efficacy after the continuous inhibition of VEGFR2. (a) Schematic diagram of experimental protocol. (b) Whole images of the intratumoral distribution of fluorescently labeled LNPs. Left panel and right panel denote only LNPs and LNPs with pretreatment of three RGD-MEND injections, respectively. Red dots and green dots denote LNPs and tumor endothelium, respectively. Scale bars: 1,000 μm. (c) Areas of red pixels were calculated with ImageJ software. Pixel area of the LNPs were normalized by nucleus areas (n = 9–11). (d) Fluorescent intensity and (e) coefficient of variance of histogram of single dispersed cancer cells were determined by FACS analysis. (f) Accumulation of LNPs was determined using radioisotope labeled-LNPs. Radioactivity of LNPs labeled with [3H]-cholesteryl hexadecyl ether was measured by liquid scintillation counting at 24 hours after the injection. (g) The effect of improved intratumoral distribution on anticancer treatment by liposomal-doxorubicin (DOX-LNP). After the tumor volume reached 100 mm3, DOX-LNP and/or the RGD-MEND were administered five times (n = 5). Tumor volumes were chronologically measured according to the equation= (major axis (mm)) × (minor axis (mm))2 / 2. Arrows indicate the injection of therapeutics. LNPs, lipid nanoparticles; FACS, fluorescence-activated cell sorting; RGD-MEND, RGD-modified liposomal siRNA; VEGFR2, VEGF receptor 2.

