
Figure 15.
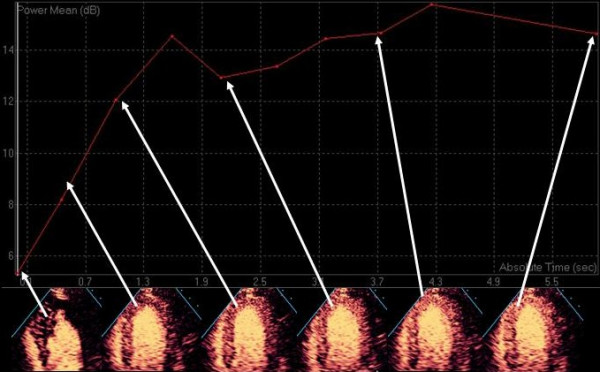
The raw signal intensity data from the apical septal segment is plotted against time after destruction.
Official websites use .gov
A
.gov website belongs to an official
government organization in the United States.
Secure .gov websites use HTTPS
A lock (
) or https:// means you've safely
connected to the .gov website. Share sensitive
information only on official, secure websites.
The raw signal intensity data from the apical septal segment is plotted against time after destruction.