
Figure 4.
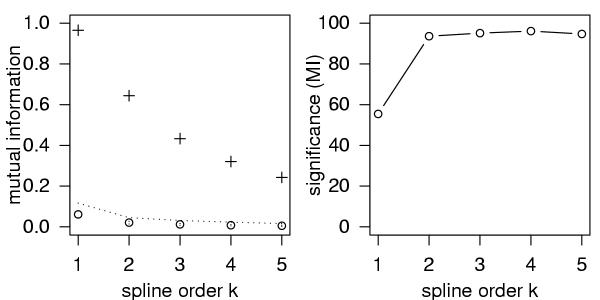
Mutual information calculated for a dataset of 300 data points drawn from the distribution shown in Figure 1 (crosses). The number of bins was fixed to M = 6. The average mutual information for 300 shuffled realisations of the dataset is shown (circles) together with the standard deviation as error-bars. The largest value found within the ensemble of shuffled data is drawn as a dotted line (left). The significance was calculated from Eq. (13) (right).