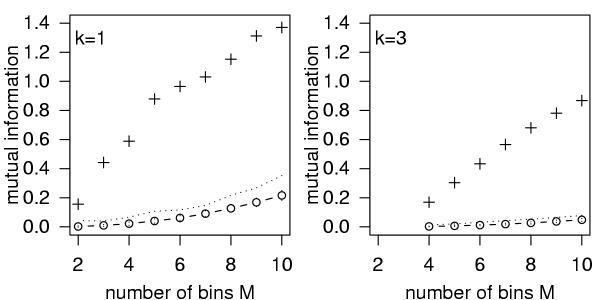
Figure 5.

Based on the distribution of Figure 1, the mutual information for 300 data points and two spline orders k = 1 and k = 3 is shown as a function of the number of bins M (crosses) together with mean (circles) and standard deviations (error-bars) of 300 surrogates. The dotted lines indicate the largest mutual information found within the ensemble of surrogate data.
