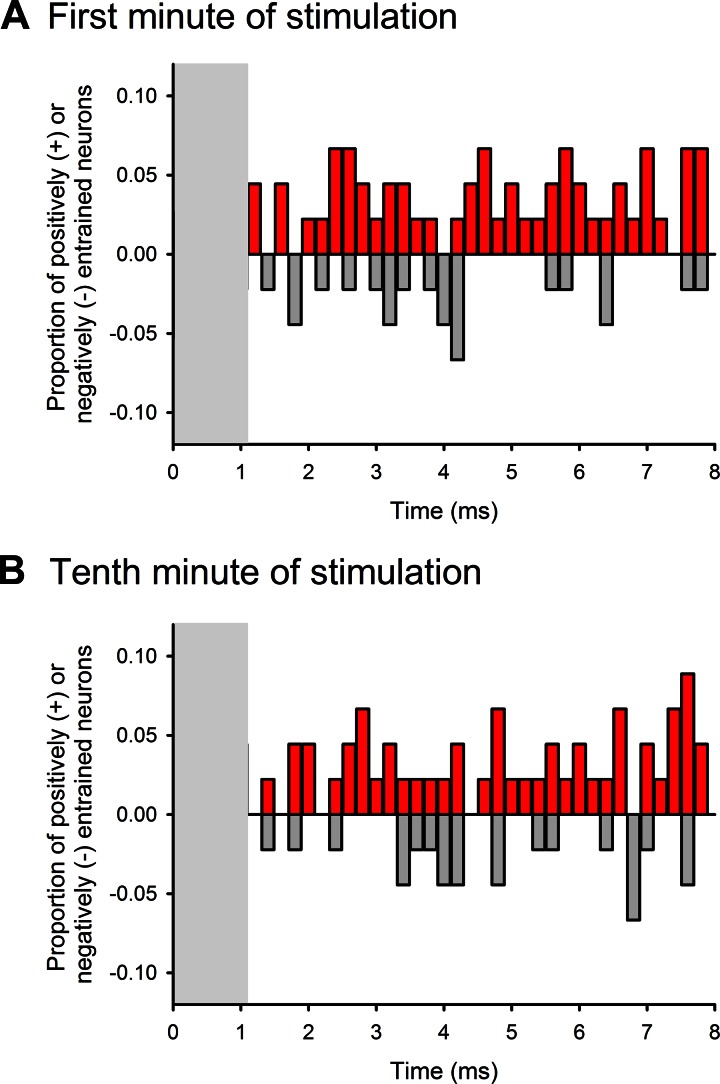
Fig. 5.
Analysis of GPi stimulation-related activity changes of BGMT cells at specific interstimulus times. Response profiles are shown for the 1st and 10th min of stimulation, summarized across all cells (see methods and results for details of analysis). Increases in the probability of firing are shown as red (upward), whereas decreases are shown in gray (downward). In some cells, the first ms of the interstimulus interval was affected by the stimulation artifact. These intervals are therefore not shown (gray rectangles).

