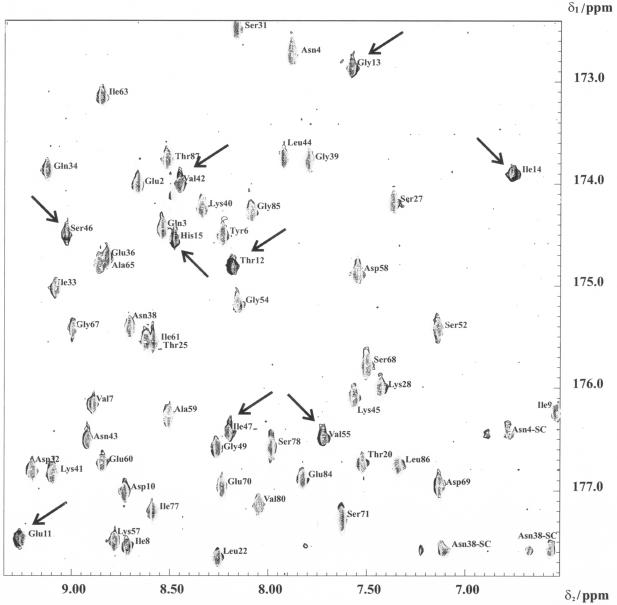
FIG. 3.
Binding of HPrK/P to HPr detected in a 2D TROSY-H(N)CO experiment. An overlay plot of 2D TROSY-H(N)CO spectra of HPr in the presence or absence of HPr-K/P recorded at an 800-MHz proton frequency at 303 K is shown. Only a part of the spectrum is shown. 1H and 13C′ cross peaks of free HPr and those of HPr in the presence of HPrK/P are shown. The residues that are strongly broadened in the presence of HPr-K/P are denoted by arrows. The sample initially contained 320 μl of 0.5 mM uniformly 13C- and 15N-enriched HPr from S. aureus in 90% H2O-10% D2O, pH 7.0 (gray cross peaks). Appropriate amounts of freeze-dried HPrK/P were added to obtain a solution containing 0.25 mM (monomer concentration) HPrK/P (black cross peaks).

