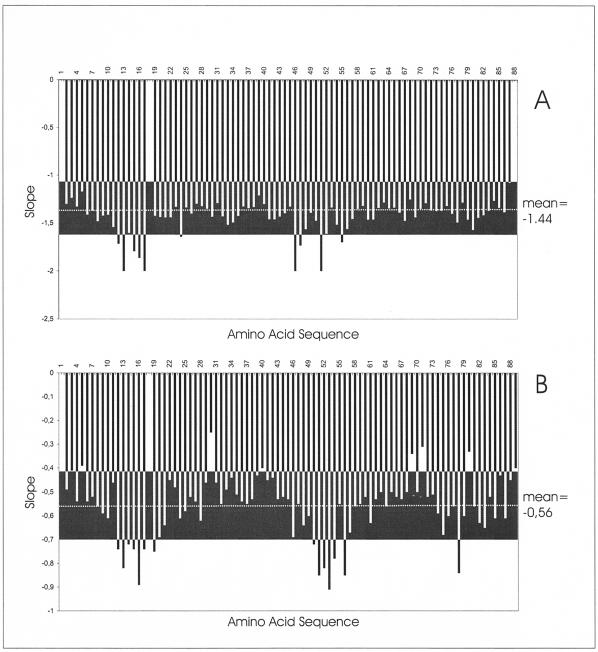
FIG. 4.
Volume changes of amide and carbonyl cross peaks after addition of HPrK/P. The same set of samples was used as that described for Fig. 3. The graphs show the relative volume decrease ΔVi {ΔVi = [Vi(HPrK/P = 0)] − [Vi (HPrK/P = 0.25 mM)]/Vi(HPrK/P = 0)} of the 1H,15N-HSQC TROSY (A) and 2D TROSY-H(N)CO (B) cross peaks at half saturation of HPr with HPrK/P. Data were recorded at an 800-MHz proton frequency and 303 K. The mean values <ΔVi > (broken lines) and the range defined by the mean value ± the standard deviation s are depicted as black boxes.

