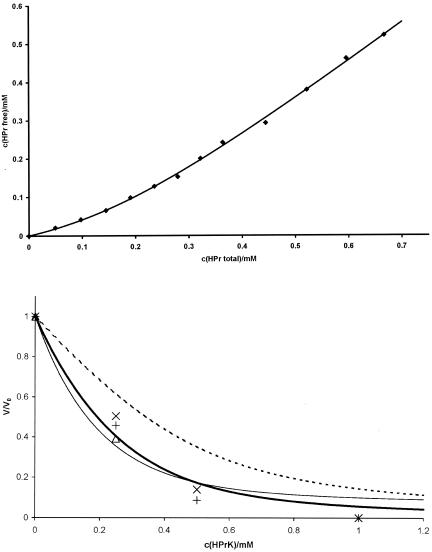
FIG. 6.
Binding constant of HPr to HPrK/P and fit of volume changes induced by HPr-HPrK/P interaction with different models. (Top) HprK/P (0.2 mM) from S. xylosus in D2O in 50 mM Tris-HCl, pH 7.5, was titrated with a 4 mM HPr S. aureus solution in the same buffer. 1D 1H spectra were recorded at 303 K at different HPr-to-HPrK/P ratios. The concentration of free HPr was determined from the intensity of the Hδ resonance of Leu81. The concentration c(HPrfree) of free HPr was fitted as function of the total concentration c(HPrtotal) of HPr (and corrected for changes of the HPrK/P concentration) with equation 1, calculated by using c(HPrfree) = c(HPrtotal) × PA. A dissociation constant Kd and a number N of binding sites per HPrK/P monomer were obtained as 0.10 ± 0.02 mM and 1.02 ± 0.05. (Bottom) The same set of samples was used as that described for Fig. 3. The volume dependence of the cross peaks of a few selected residues in the 1H,15N-HSQC TROSY spectra on the HPrK/P concentration was calculated with an N of 1.02 and a Kd of 0.10 mM with either equation 7 (broken line), 8 (solid bold line), or 9 (solid thin line). The data for Leu53 (+), Gly54 (×), and Val55 (▵) which are most probably involved in the protein-protein interaction are shown. Note that the signal of Val55 was too weak to be observed at higher concentrations.

