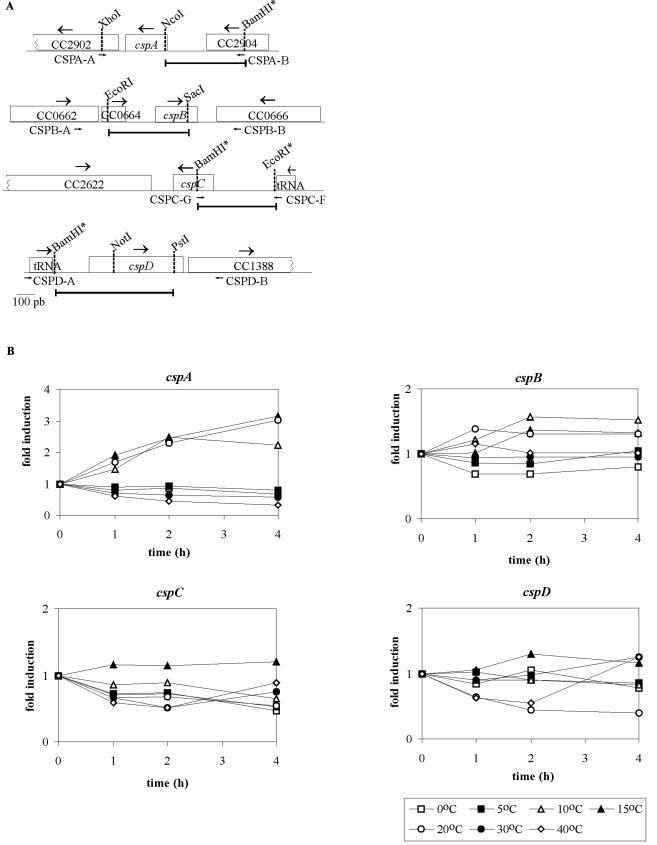
FIG.3.
(A) Schematic representation of the csp genes. The DNA fragments cloned to the pRKlacZ290 vector in the transcriptional fusions are indicated by bars. The small arrows indicate the primers used to amplify each region from the genome. Some restriction sites are indicated, and the sites inserted by PCR are labeled with an asterisk. (B) Analysis of the cold induction of the csp genes. Cells harboring the transcription fusions of each gene were grown at 30°C up to mid-log phase and were then transferred to different temperatures. Expression of each construct was measured by β-galactosidase activity assays (29) at sequential time points, and the results are shown as relative measurements of induction.

