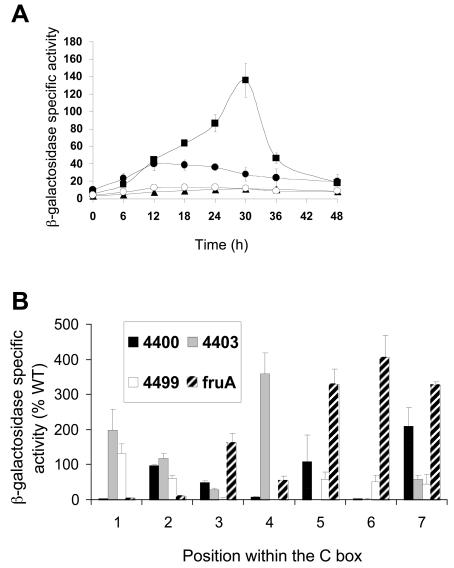
FIG. 2.
Mutational analysis of the C box centered at −51 bp in the fruA promoter region. (A) Developmental lacZ expression was measured for M. xanthus strains with a C to A change at −49 bp (▪) or −54 bp (○). The wild-type fruA promoter region from −185 to +50 bp (•) and the vector with no insert (▴) were included as controls. The meaning of points and error bars is the same as is described in the legend to Fig. 1. (B) Comparison of the effects of single-base-pair transversion mutations in four different C boxes. The x axis represents the position in the C box corresponding to the consensus sequence CAYYCCY with the A being position 2, etc. The bars represent the average maximum developmental lacZ activity expressed as a percentage of the wild-type promoter activity for the C boxes centered at −49 bp in the Ω4400 and Ω4403 promoter regions or centered at −33 bp in the Ω4499 promoter region or centered at −51 bp in the fruA promoter region (Table 2). Error bars show 1 standard deviation of the data.

