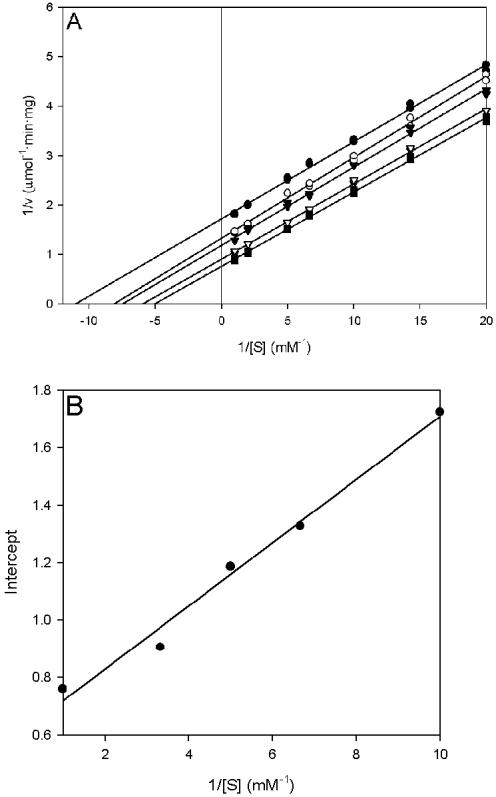
FIG. 6.
Lineweaver-Burk and secondary plots of PvdH activities with l-2,4-diaminobutyrate and α-ketoglutarate as substrates. (A) Lineweaver-Burk plot showing the relationship of PvdH activity and l-2,4-diaminobutyrate concentration. The α-ketoglutarate concentration was fixed at 100 μM (•), 150 μM (○), 200 μM (▾), 300 μM (▿), or 1 mM (▪). (B) y intercepts from the Lineweaver-Burk graph plotted against the reciprocal of the α-ketoglutarate concentration.

