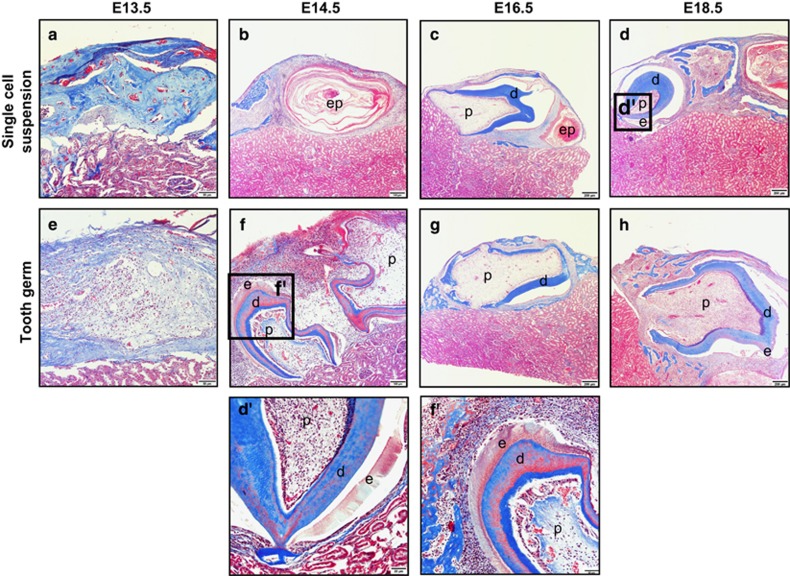
Figure 2.
Histological analysis of transplants. (a) At E13.5, the single-cell suspensions had no tissue boundary. (b) At E14.5, the single-cell suspensions formed several epithelial pearls. (c) At E16.5, pulp tissue, dentin and apical constriction were observed, but no enamel was observed. (d) At E18.5, the single-cell suspensions started to form immature enamel tissue. (e) The tooth germ transplants formed a boundary between the epithelial and mesenchymal tissue. (f, h) Pulp tissue, dentin, apical constriction and immature enamel tissue were observed in both the E14.5 and E18.5 suspensions, (g) but no enamel was observed in the E16.5 suspensions. Scale bar for a and e: 50 μm; for b and f: 100 μm; for c, d, g and h: 200 μm; for d': 20 μm; and for f': 50 μm. E, embryonic day.

