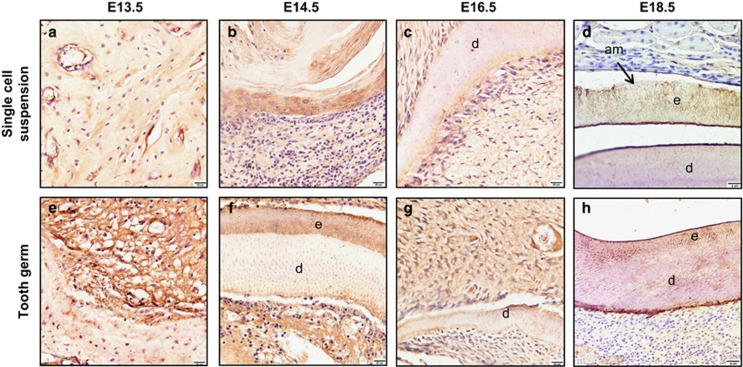
Figure 3.
Immunohistochemical analysis of amelogenin expression. (a–c) At E13.5, E14.5 E16.5, the single-cell suspensions has no obvious positive staining of amelogenin. (d) The single-cell suspensions started to exhibit positive staining at E18.5. (f, h) The tooth germ transplants revealed a clear epithelial–mesenchymal boundary at E13.5. (f, h) The amelogenin-positive staining could also be detected at E14.5 and E18.5. (g) However, there has no obvious positive staining at E16.5. Scale bar for a–g: 20 μm and for d and h: 8 μm. E, embryonic day.

