Figure 4.
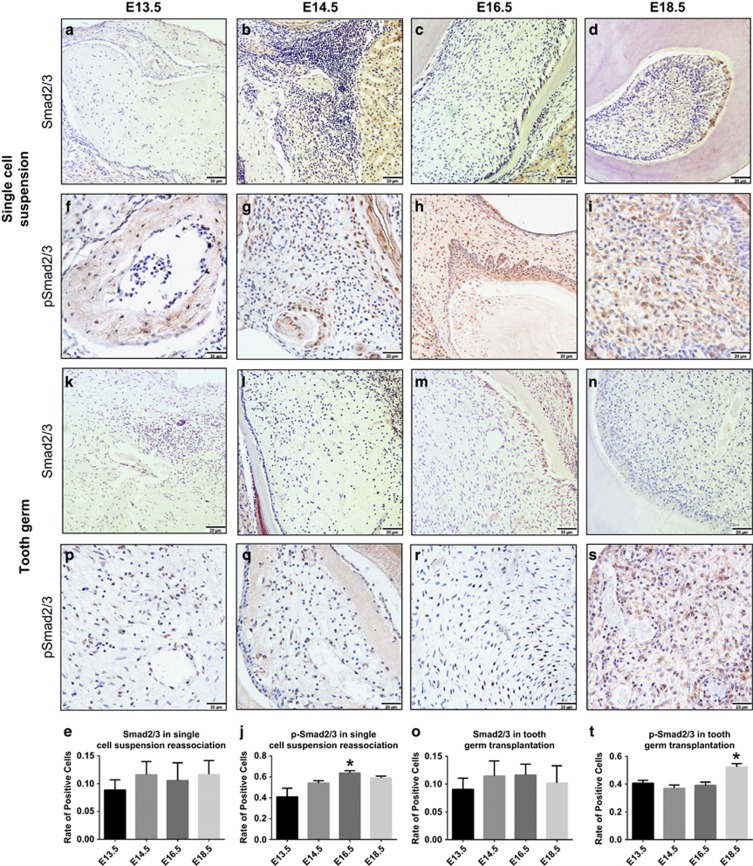
Immunohistochemical analysis of the expression and phosphorylation of Smad2/3. The Smad2/3- and p-Smad2/3-positive cells were counted in each view, and the rate of positively stained cells was determined. (a–e, k–o). Smad2/3 (stained brown) expression was analysed in the cell cytoplasm. The rate of cells positively stained for Smad2/3 was the same across all of these stages. Scale bar: 20 μm. (f–j) p-Smad2/3 expression (brown staining) was analysed in the cell nucleus. The single-cell suspensions had a higher rate of positive cells at E16.5. (p–t) However, the tooth germ had a higher rate of positive cells at E18.5. All data are presented as the mean±standard deviation, *P<0.05 by unpaired t-test. Scale bar: 20 μm. E, embryonic day.

