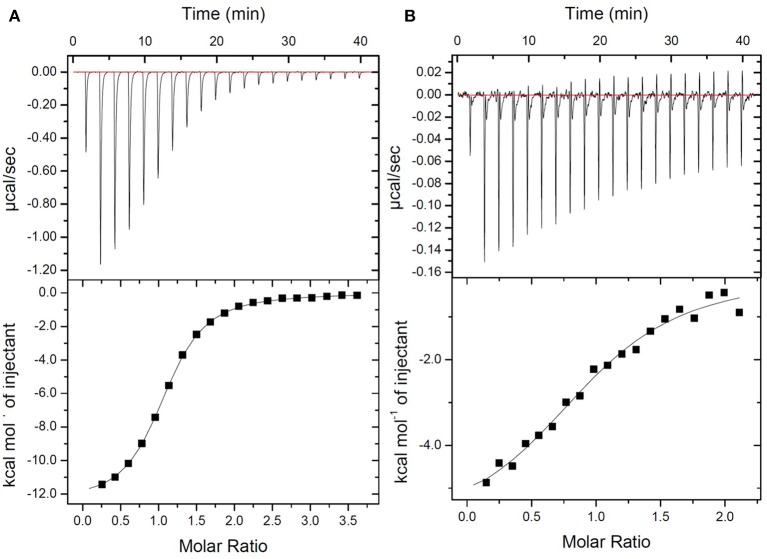
Figure 2.
Thermodynamic evaluation of Ac-L-Lys-D-Ala-D-Ala-OH binding to DLF-1. Top: Raw curve of power vs. time. Bottom: Fit of integrated peak areas (heat released per injection) used to determine the thermodynamic parameters presented in Supplementary Table 1. (A) Representative ITC data measuring the thermodynamics of binding of peptide to Vancomycin. Peptide (600 μM) was titrated into a solution containing vancomycin (32 μM) in 1X PBS at 25°C. (B) Representative ITC data measuring the thermodynamics of binding of peptide to DLF-1. One percent of DMSO was added to control and test titrations, as it increased solubility of DLF-1.

