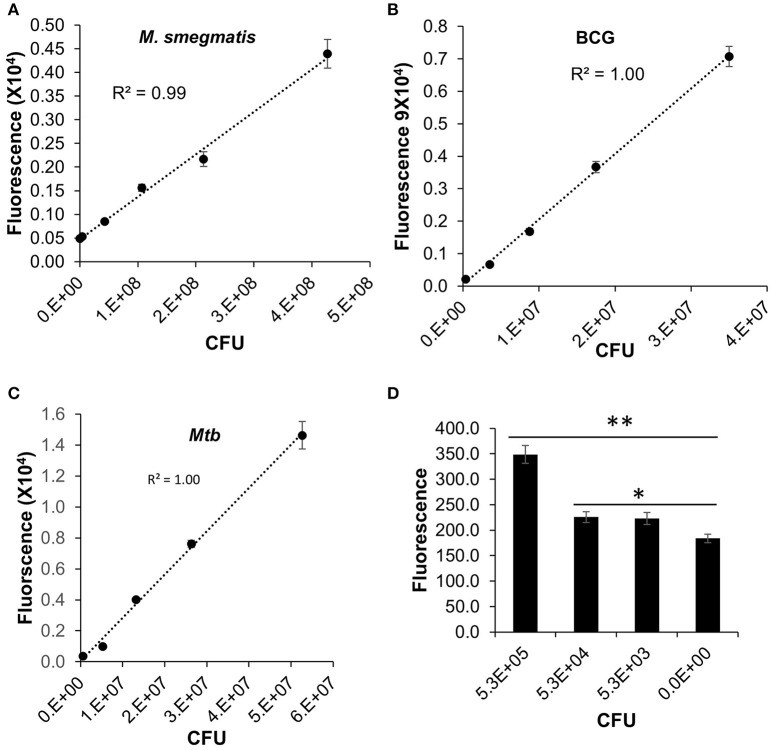
Figure 4.
Direct labeling of different mycobacteria with DLF-1. Fluorescent intensities of DLF-1 labeled bacteria were plotted against the numbers of bacteria. (A–C) represent plots for M. Smegmatis, M. bovis BCG, and Mtb CDC1551, respectively. Linear trend lines with R-squares are also displayed for each plot. Linear range: M. smegmatis 4.3 × 10⁵−4.3 × 10⁷; M. bovis BCG 3.5 × 10⁴−3.5 × 10⁷; and Mtb 5.3 × 10⁴−5.3 × 10⁷. (D) Minimum number of Mtb within the detectable linear range. **P < 0.01; *P < 0.05. Error bars represent standard errors of means calculated based on results from three independent experiments.

