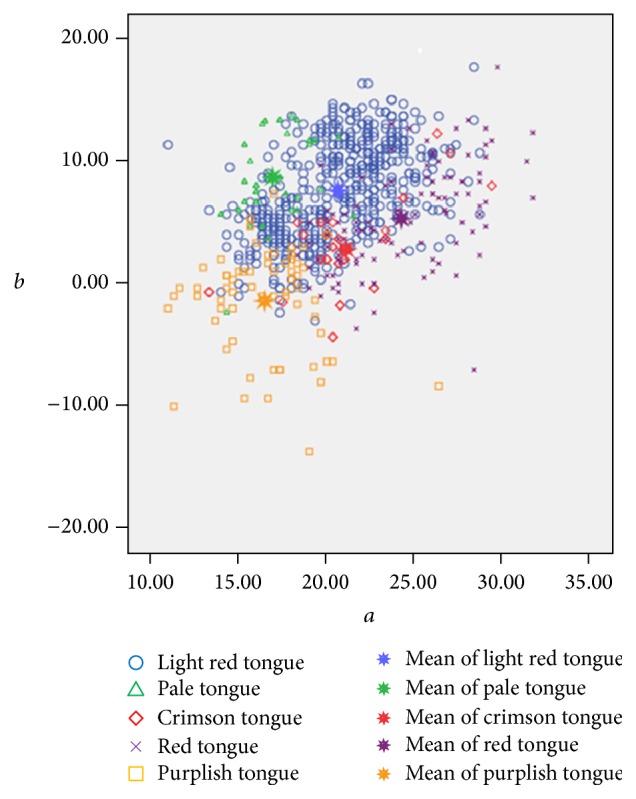
Figure 6.

Distribution of respective average tongue colors in a ∗ b ∗ plane color space. Note: (1) a ∗ value: purplish tongue < pale tongue < light red tongue < crimson tongue < red tongue, which indicates that the red components are decreasing. (2) b ∗ value: purplish tongue < crimson tongue < red tongue < light red tongue < pale tongue, which indicates that the blue components are decreasing, while the yellow component is increasing.
