Figure 2.

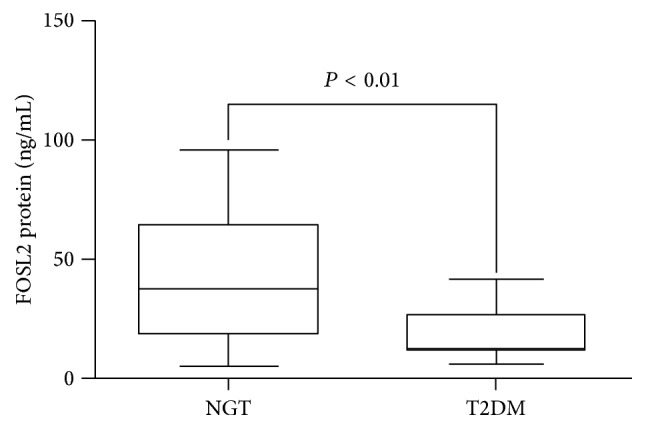
The comparison of the expression levels of FOSL2 protein between the NGT and T2DM groups. Protein was measured by ELISA. Data are presented as the mean ± standard deviation (SD).

The comparison of the expression levels of FOSL2 protein between the NGT and T2DM groups. Protein was measured by ELISA. Data are presented as the mean ± standard deviation (SD).