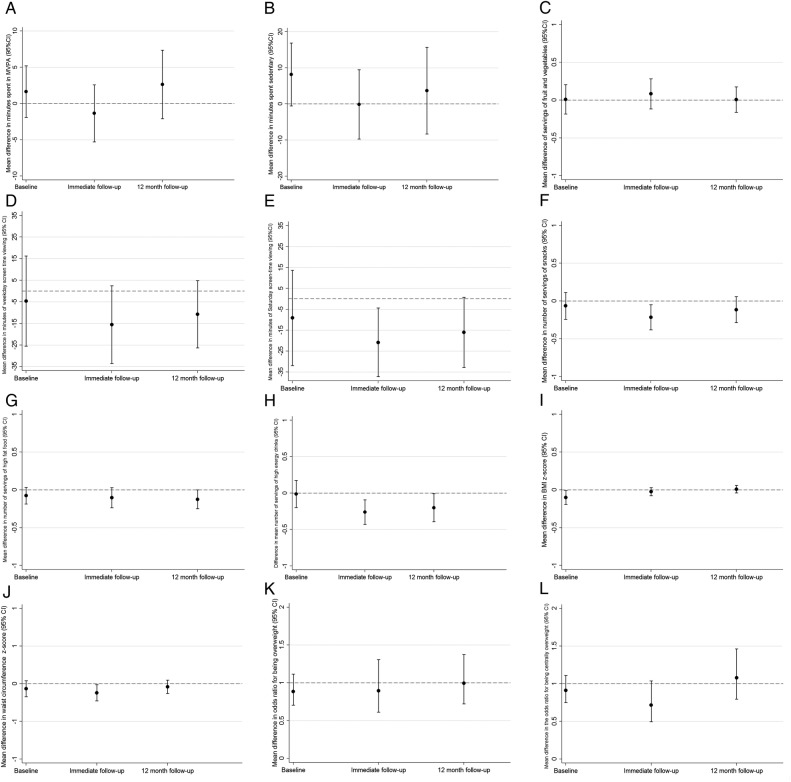
Figure 2.
Difference in means and ORs for the intervention compared with the control group for the three primary outcomes and nine secondary outcomes, assessed at baseline, first follow-up (conducted immediately after the end of the intervention) and second follow-up (12 months postintervention). (A) Accelerometer-assessed time spent in moderate to vigorous physical activity. (B) Time spent in sedentary behaviour. (C) Servings of fruit and vegetables per day. (D) Time spent screen viewing on weekdays. (E) Time spent screen viewing on Saturdays. (F) Servings of snacks per day. (G) Servings of high-fat foods per day. (H) Servings of high-energy drinks per day. (I) Body mass index z-score (as a continuous variable). (J) Waist circumference z-score (as a continuous variable). (K) General overweight or obesity (based on BMI measurements). (I) Central overweight/obesity based on waist circumference measurements. The figures all show differences in means for continuous variables (graphs A–J) and ORs for binary outcomes (graphs K and L), comparing those in the intervention arm of the trial with those in the control arm (dots), together with 95% CIs (vertical lines with horizontal caps representing the limits). The dashed horizontal lines represent the null values (zero for all differences in means of continuous variables and one for ORs of binary outcomes).

