Figure 1.
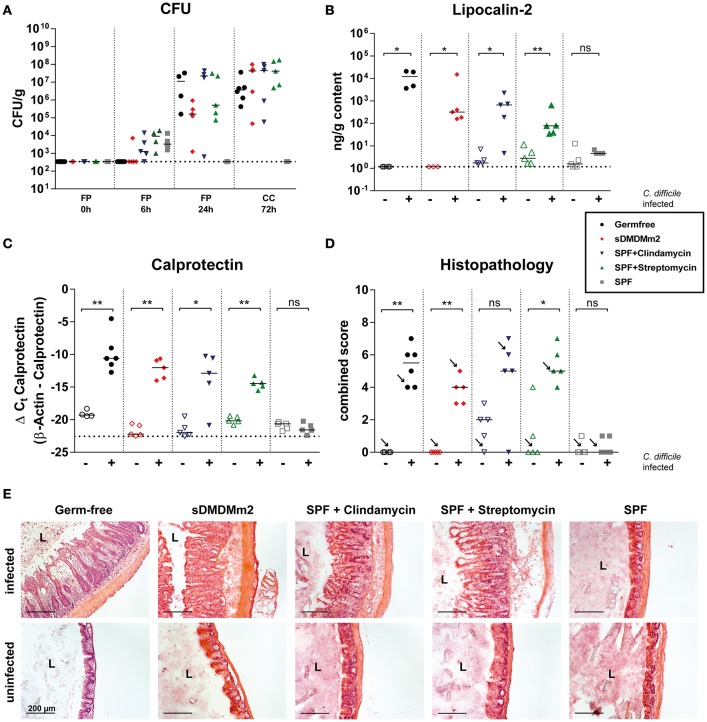
Infections with C. difficile in sDMDMm2 mice resemble infections in antibiotic-treated mice. Cohorts of germ-free (black circles, n = 6), sDMDMm2 (red diamonds, n = 5), clindamycin-treated SPF (purple inverted triangles, n = 5), streptomycin-treated SPF (green triangles, n = 5), and SPF control (gray squares, n = 5) mice were gavaged with 103 CFU C. difficile DH1916 (filled symbols) or PBS vehicle as control (open symbols). (A) Comparison of CFU of C. difficile in fecal pellets (FP) or cecal contents (CC) at different time points over course of infection. (B) Comparison of lipocalin-2 measured by ELISA in cecal content after 72 h of infection. (C) Comparison of calprotectin from cecal tissue after 72 h of infection measured by qPCR. Values show the ΔCt derived from measured values of calprotectin with β-actin as control. (D) Histopathological evaluation of H&E stained sections of cecum tissue at time of necropsy (72 h). Arrows indicate the representative mice depicted in (E). (E) Representative images of H&E stained sections of cecum tissue at time of necropsy (72 h). L, Lumen; Scale bars: 200 μm. Statistical analyses in (B–D) used Mann-Whitney-U tests to compare uninfected with infected animals at individual timepoints. Each symbol represents one individual. Bars indicate medians. Dotted lines indicate lower limit of detection. ns, not statistically significant (p ≥ 0.05); *p < 0.05; **p < 0.01.

