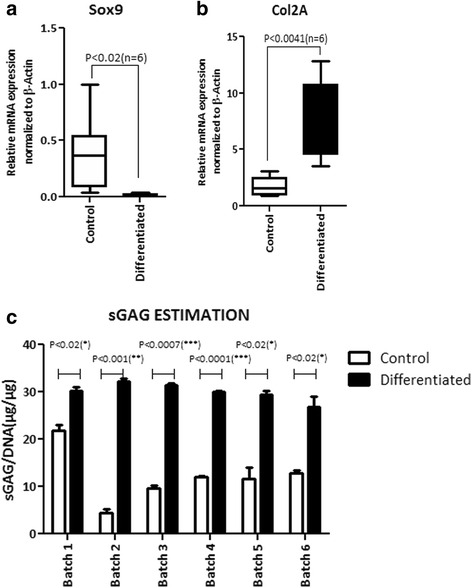
Fig. 2.

Quantification of gene expression and sGAG. Quantitative mRNA expression of a SOX9 and b Col2A in the control (white bar) and chondrogenically differentiated Stempeucel® (black bar) by real-time PCR analysis (n = 6). c Sulfated glycosaminoglycan (sGAG) content in the control (white bar) and chondrogenically differentiated Stempeucel® (black bar) by DMMB dye-binding assay. The sGAG values were normalized to the DNA content in the control and chondrogenically differentiated Stempeucel® (n = 6). Results are represented as mean with SEM
