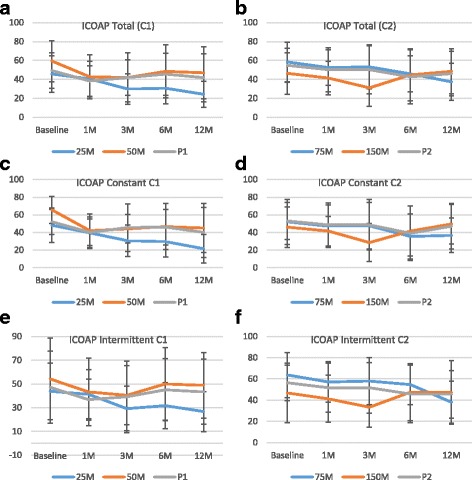
Fig. 7.

ICOAP results. ICOAP a, b total, c, d constant pain, and e, f intermittent pain results are shown for cohorts 1 (a, c, and e) and 2 (b, d, and f). Data are presented as mean ± SD. 1 M, 3 M, 6 M, and 12 M = 1, 3, 6, and 12 months, respectively; C1 cohort 1, C2 cohort 2, ICOAP intermittent and constant osteoarthritis pain, M million cells, P placebo
