
Fig. 3.
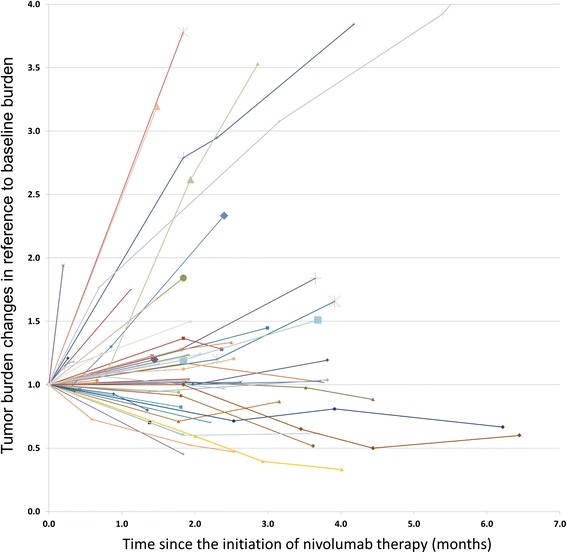
Spider plot of tumor burden changes during nivolumab therapy using irRECIST. Longitudinal changes of tumor burden during therapy are shown in reference to baseline, showing baseline tumor burden as 1.0. The scan time points with the appearance of new target lesions are indicated by larger markers