Figure 3.
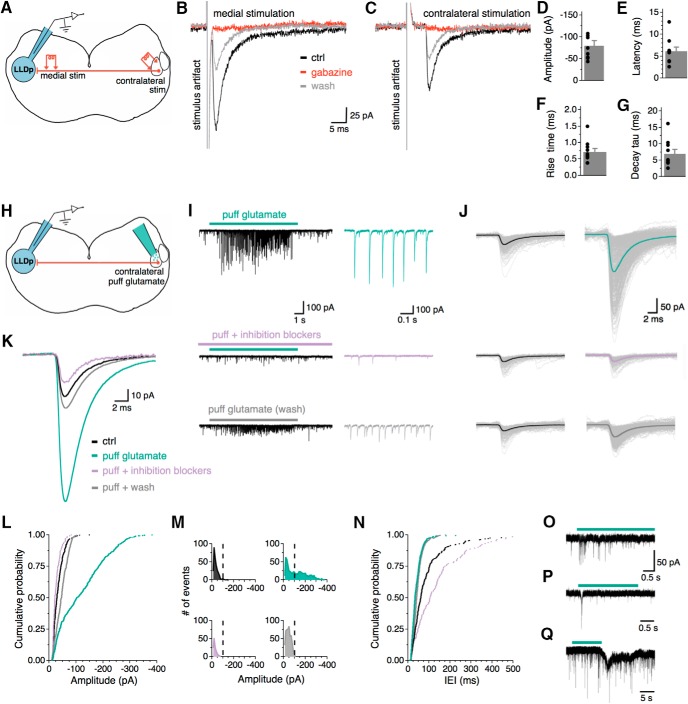
IPSCs can be evoked electrically or chemically from activation of the contralateral LLDp. A, Schematic of the experimental setup for electrical activation of contralateral LLDp, highlighting ipsilateral recording site (blue), and the following two stimulating locations: medial (left) and in the contralateral LLDp (right). B, C, Averaged eIPSCs from medial LLDp (B) and contralateral LLDp (C) stimulation in the same neuron. Note the larger amplitude and shorter latency in the medial eIPSC. Bath application of gabazine (10 μm, red) completely abolished both medial and contralateral eIPSCs. D–G, The contralateral eIPSC population data for amplitude, latency, 20–80% rise time, and decay tau (n = 10). H, Schematic of experimental setup for chemical activation of contralateral LLDp, highlighting ipsilateral recording site (blue), and direct puff application of glutamate in the contralateral LLDp (green, right). I, For a single neuron, puff application of glutamate (150 μm, 5–10 psi, 10 s) on the contralateral LLDp produced PSCs that were abolished by bath application of gabazine (10 μm) and strychnine (1 μm). Enlarged views of PSCs are shown to the right during puff glutamate (top, green), puff glutamate with inhibition blockers (middle, purple), and wash (bottom, gray). J, Overlay of individual PSCs (thin lines) and their average (thick line) during control (left, black) and during glutamate puff application in the following conditions: ACSF (top), inhibition blockers (middle), and wash (bottom). K, Overlay of averaged PSCs. L, Cumulative probability of PSC amplitude shows that PSCs during puff glutamate (green) have larger amplitudes compared with control (black) and puff glutamate with inhibition blockers (purple) conditions in a sample cell. M, Distribution of PSC amplitude shows a bimodal distribution of PSCs during glutamate application (green), with a population of events >100 pA, which is not seen in the control or during the inhibition blockers condition. N, Cumulative probability of the IEI between PSCs shows a decrease in IEI during puff glutamate (green) and wash (gray) compared with control (black), and puff glutamate compared with inhibition blockers (purple). O–Q, Sample traces from three individual neurons with varying degrees of responsiveness to contralateral glutamate puff (green bar). ctrl, Control.

