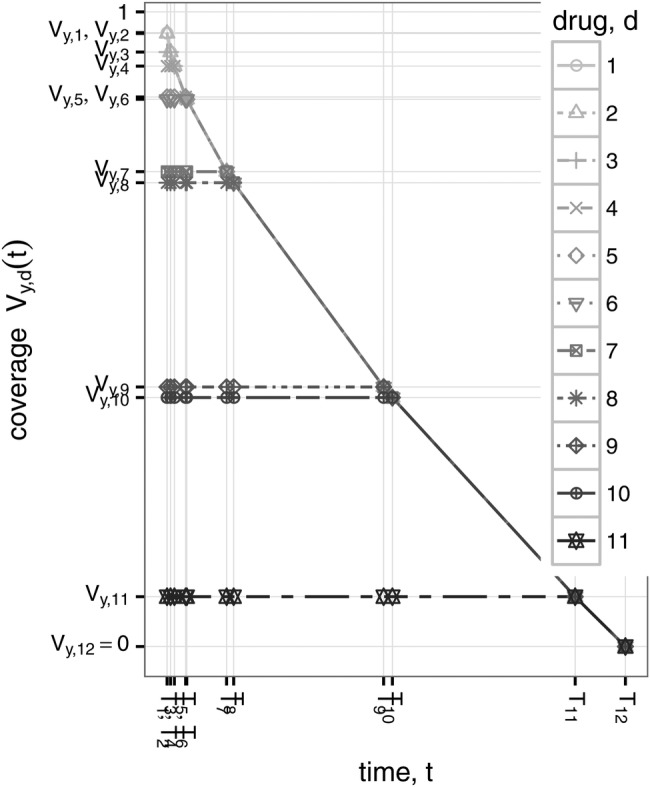
Figure 3.

The EOI is based on this very simple model of the change in coverage over time (equation A.3). In this example, the best available coverage of Gram-negative CLABSIs (first panel of figure 2) declines rapidly at first, then more slowly as more drugs are used. The amount of time until all drugs become ineffective depends on model parameters β and n, but the shape of the curve depends only on the initial coverage provided by each available drug (first panel of figure 2). CLABSIs, central-line associated bloodstream infections; EOI, Empiric Options Index.
