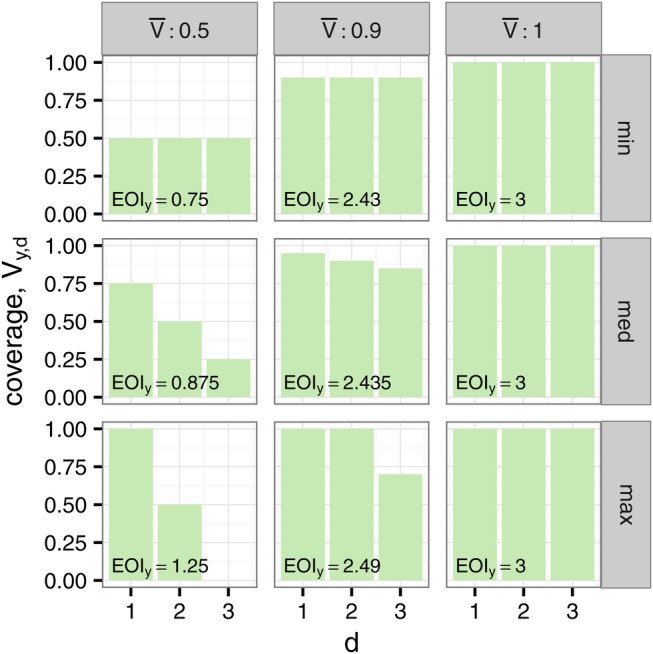
Figure 5.

The effect of the distribution of resistance on the EOI. In each case, there are Dy=3 treatment options. When all drugs provide full coverage EOIy=Dy=3 (right column). Reducing the average coverage  has the largest effect when all drugs provide the same coverage (top row), and the smallest effect when
  drugs provide full coverage (bottom row). EOI, Empiric Options Index.
