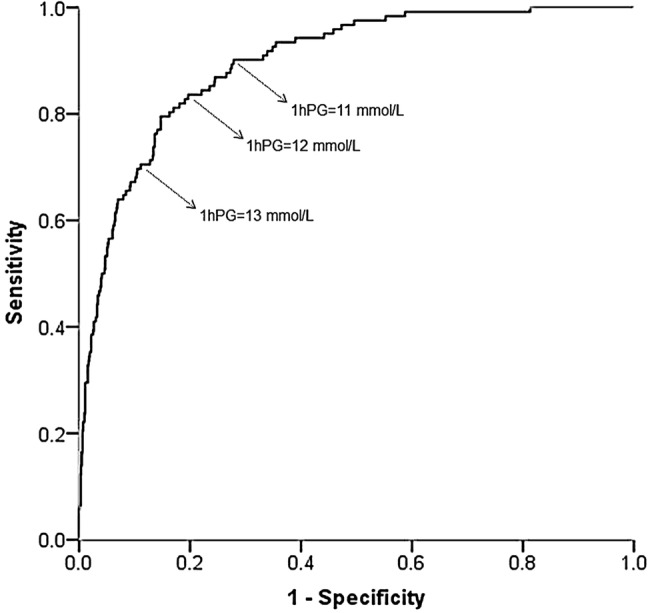
Figure 2.

In a ROC analysis evaluating 1hPG for diagnosing diabetes (defined by 2hPG value ≥11.1 mmol/L), 12 mmol/L was identified as the optimal balance between sensitivity and specificity with an AUC (95% CI) of 0.90 (0.87 to 0.92). The sensitivity and specificity were both 82%, while the positive and negative predictive values were 40% and 97%, respectively. 1hPG, 1-hour plasma glucose; 2hPG, 2-hour plasma glucose; AUC, area under the ROC curve; ROC, receiver operating characteristic.
