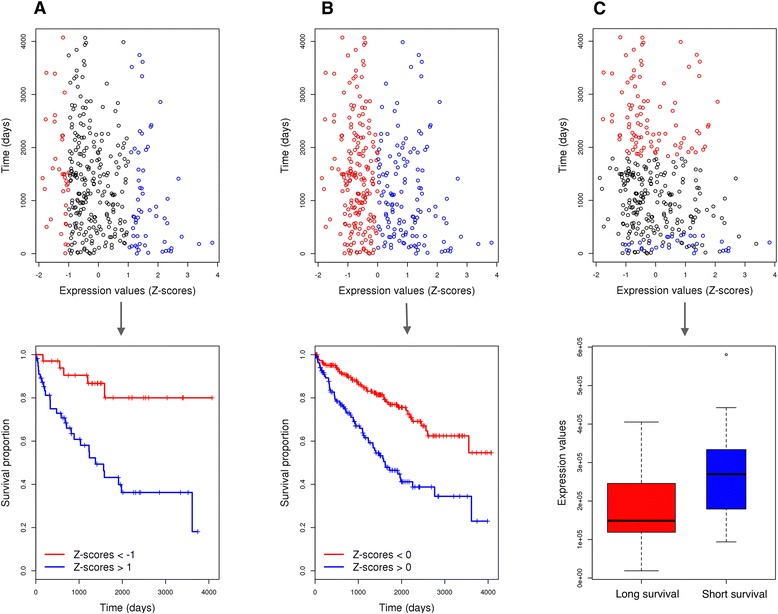
Fig. 1.

Feature selection process using three different approaches illustrated for the miRNA hsa-mir-21 in the KIRC cohort. a “Extreme score stratification approach”, where we compare the differences in the survival between “extremely” high expression values (Z-scores > 1, shown in blue) and “extremely” low expression values (Z-scores < −1, shown in red). b “Mean score stratification approach”, where we compare the differences in the survival between higher than average expression values (Z-scores > 0, shown in blue) and lower than average expression values (Z-scores < 0, shown in blue). c “Extreme survival stratification approach”, where we search for significant expression differences between patients that died within the first year of diagnosis (shown in blue), and patients that lived longer than 5 years (shown in red)
