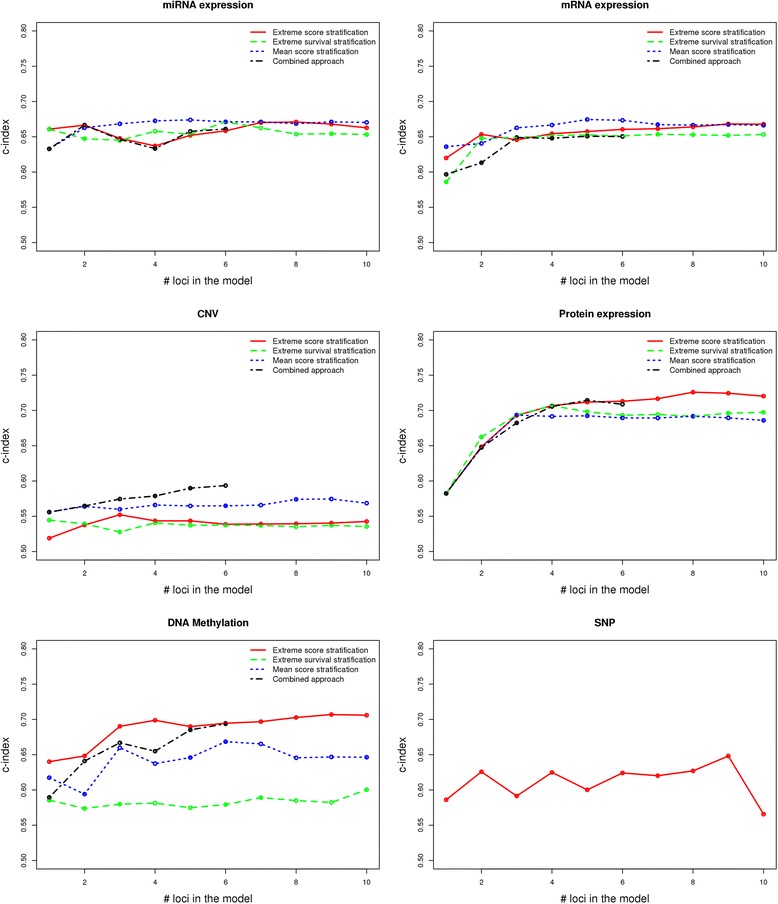
Fig. 3.

Performance of different feature selection approaches (“extreme score stratification”, “mean score stratification”, “extreme survival stratification” and combined approach) on different omics data on the KIRC cohort using 3-fold cross validation. The points at each plot show the average values across the three cross validation rounds. For clarity, the standard errors are omitted here, but are shown in Additional files 1 and 3
