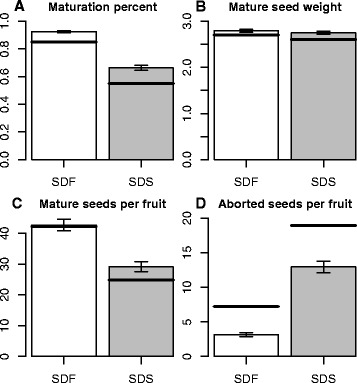
Fig. 1.

Seed weight and numbers in response to salinity. Whole population maturation percent (a), average seed weight in grams (b), number of mature seeds per fruit (c) and number of aborted seeds per fruit (d) are presented by the bars. Corresponding average levels of M82 are noted by black horizontal lines. Error bars: standard error
