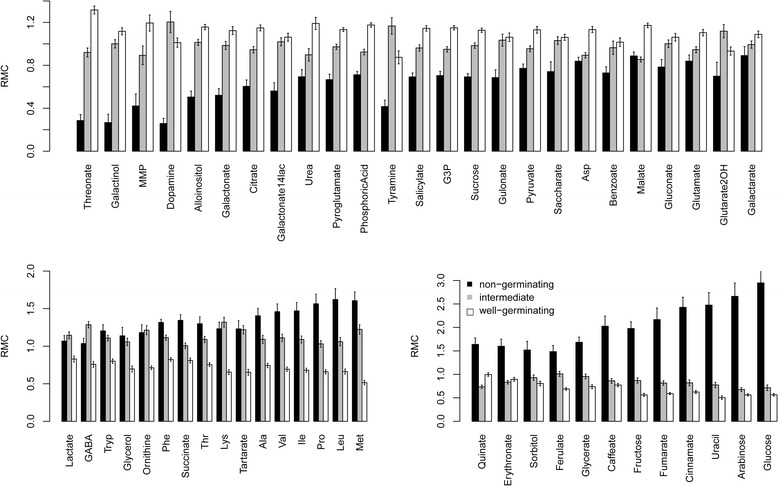
Fig. 7.

Seed RMC by germination groups. Plots tested for germination were divided according to level of germination into non-germinating (0% germination), intermediate germination (5–95%) and well-germinating (95–100%), indicated in black, gray and white, respectively. The RMC of each germination group is presented, for metabolites that significantly (p < 0.05, Bcp) differed in RMC between non-germinating and well-germinating plots. a Metabolites of ms2. b Metabolites of ms1 of the first community. c Metabolites of ms1 of the second community. Error bars represent standard error
