
Fig. 1.
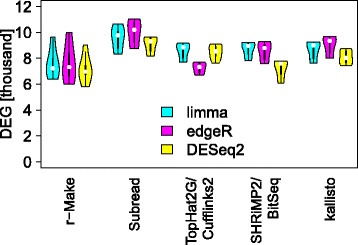
Intra-site differential expression calls. At each site, we identify genes differentially expressed between samples A and C. The y-axis [DEG] shows the number of significant differential expression calls (q<5%), reflecting sensitivity. Violin plots summarize the results for all sites. Plots for various methods of expression estimation are shown along the x-axis, with methods for differential expression calling indicated by colour