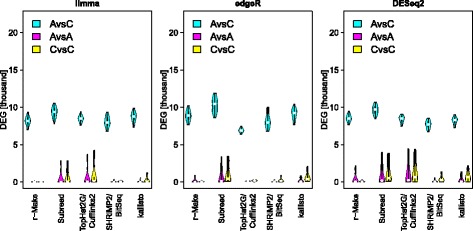
Fig. 5.

Inter-site differential expression calls after removing unwanted variation with svaseq. We identify genes differentially expressed between samples from alternative sites. The y-axis [DEG] shows the number of differential expression calls (q<5%). Violin plots summarize the results for all possible pairs of alternative sites. Each panel shows data for a particular method of differential expression calling. Plots for various methods of expression estimation are shown along the x-axis. Colour indicates the samples compared: A-vs-C (cyan), A-vs-A (magenta), and C-vs-C. High counts in same–same comparisons reflect a lack of specificity. Note the improvements relative to Fig. 3
