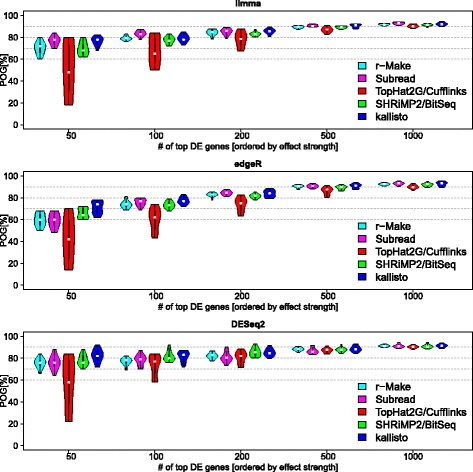
Fig. 6.

Inter-site reproducibility of differential expression calls. We assess the reproducibility of the top ranked differentially expressed genes across sites. The y-axis plots the percentage of genes (POG) identified as differentially expressed in the same direction and with significance in both alternative sites compared. We investigate this for the 50 top-ranked genes on the left of the plot, and consider larger lists going to the right along the x-axis. The violin plots summarize the results for all possible pairs of alternative sites. The observed pipeline specific effects were more pronounced for the shorter lists, which typically are of more immediate relevance in a search for leads or biomarkers. Agreement for the top 1000 genes was above 90% irrespective of pipeline choice. Results for BitSeq or kallisto and DESeq2 were also robust for shorter lists. Hidden confounders were removed from expression estimates by svaseq, and additional filters for average expression and effect strength were applied for differential expression calls. Genes meeting criteria for differential expression calls were ranked by effect size (| log2F C|)
