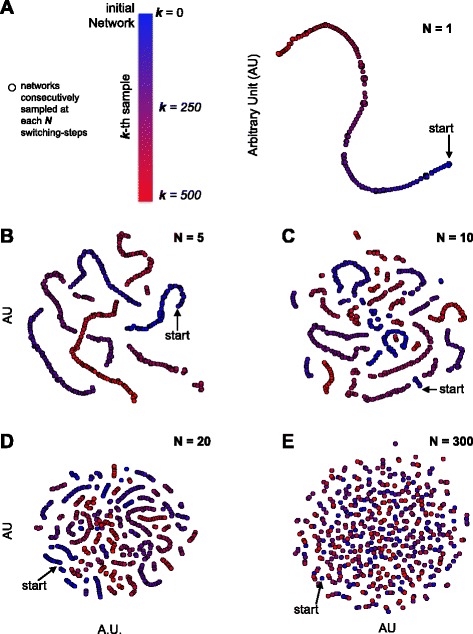
Fig. 2.

Rewired network samplings using the switching-algorithm (SA) at different sampling intervals, in terms of switching-steps (SS), as indicated by the different panel identifiers (a, b, c, d and e). Points represent sampled networks, arrows indicate a starting synthetic network, and colors indicate the sampling order. Point proximities reflect corresponding network similarities quantified through the Jaccard index. Point coordinates have been obtained with a generalized multi-dimensional scaling procedure (t-SNE)
