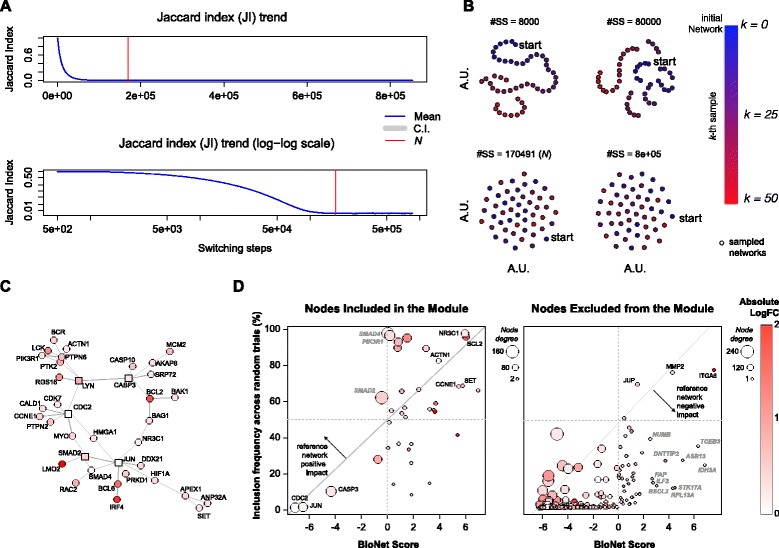
Fig. 3.

BioNet study case. a Analysis of the Jaccard index trend across switching-steps (SS) while rewiring the BioNet reference Interactome and estimation of the lower bound N; b visual inspection of the switching-algorithm Markov chain convergence to verify the suitability of the estimated bound (see Fig. 2 legend for further details); c Interactome module outputted by BioNet while analyzing the DLBCL dataset; d scatter plots of BioNet scores vs. frequency of inclusion in the rewired solutions for all the nodes included in the BioNet module (left plot) and for all the other Interactome nodes contained in the DLBCL dataset (right plot)
