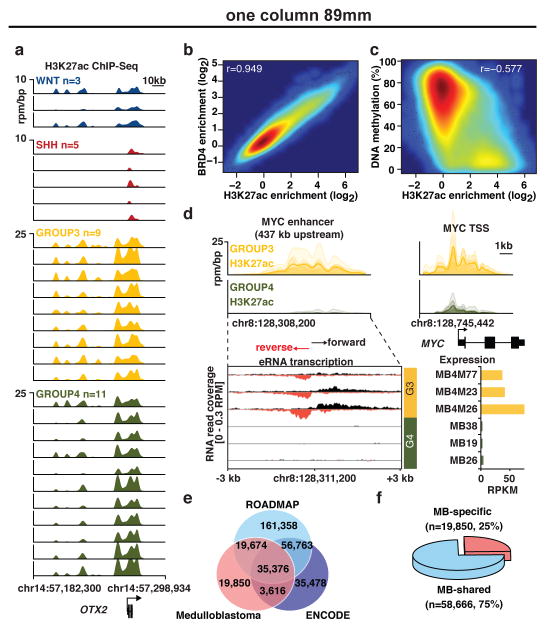
Figure 1. The enhancer landscape of primary medulloblastoma.
(a) Highly active enhancers at the OTX2 locus across 28 primary medulloblastomas.
(b) H3K27ac versus BRD4 ChIP-Seq signals at medulloblastoma enhancers (n=78,516).
(c) H3K27ac ChIP-Seq signal versus DNA methylation (WGBS) at medulloblastoma enhancers (n=78,516).
(d) Group 3-specific eRNA expression (lower left) overlapping a Group 3-specific MYC enhancer (upper left) in a subset of medulloblastomas (n=6). MYC gene expression (RPKM) is also shown for the same cases (lower right).
(e, f) Overlap of medulloblastoma enhancers with ENCODE and Roadmap enhancers.

