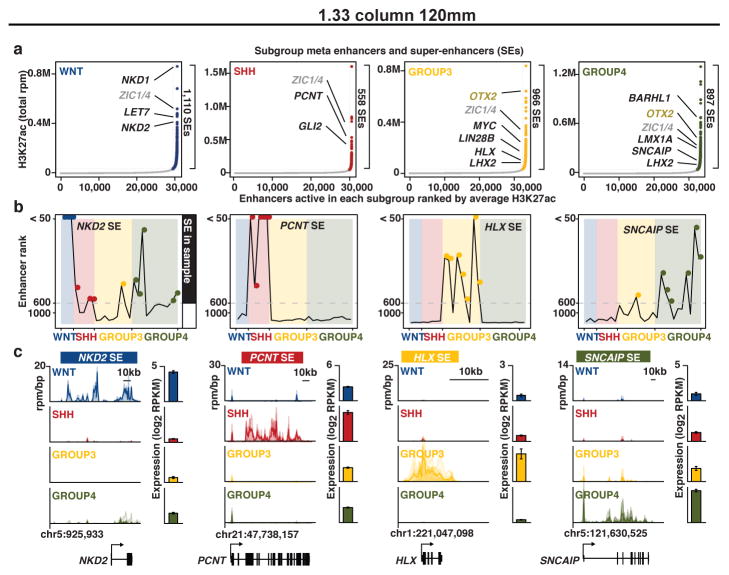
Figure 3. Medulloblastoma super-enhancers characterize subgroup-specific identity.
(a) Ranked enhancer plots defined across composite H3K27ac landscapes of WNT, SHH, Group 3, and Group 4 medulloblastomas. Select genes associated with SEs in each subgroup are highlighted and shaded according to enhancer class specificity.
(b) Enhancer rankings for candidate subgroup-specific SEs across all samples according to subgroup.
(c) Meta tracks of H3K27ac ChIP-Seq signal (rpm/bp) across medulloblastoma subgroups for the loci shown in (b). Candidate gene expression (mean RPKM) is shown to the right of each H3K27ac track (n=140). Error bars represent standard deviation (s.d.) of the mean.

