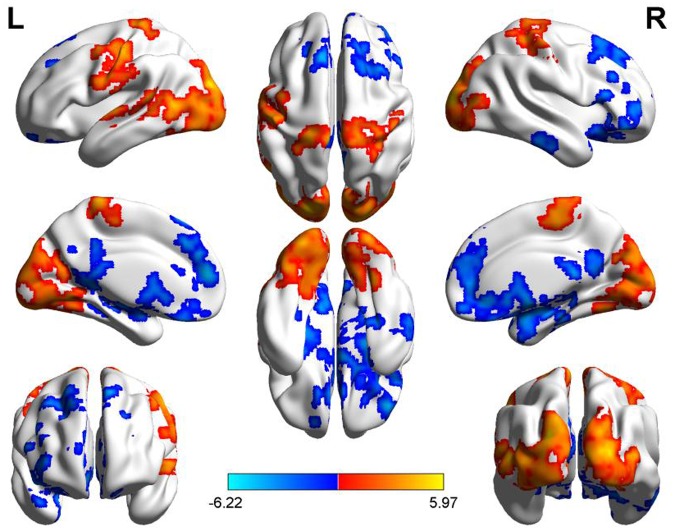
FIGURE 2.
Diurnal changes of ReHo. The final statistical maps are visualized by eight views (The first row from left to right is lateral view of left hemisphere, top side, lateral view of right hemisphere. The second row from left to right is medial view of left hemisphere, bottom side, medial view of right hemisphere. The third row is frontal and back side). Color bar indicates t-value (Red–yellow, AM > PM, blue–green, AM < PM).

