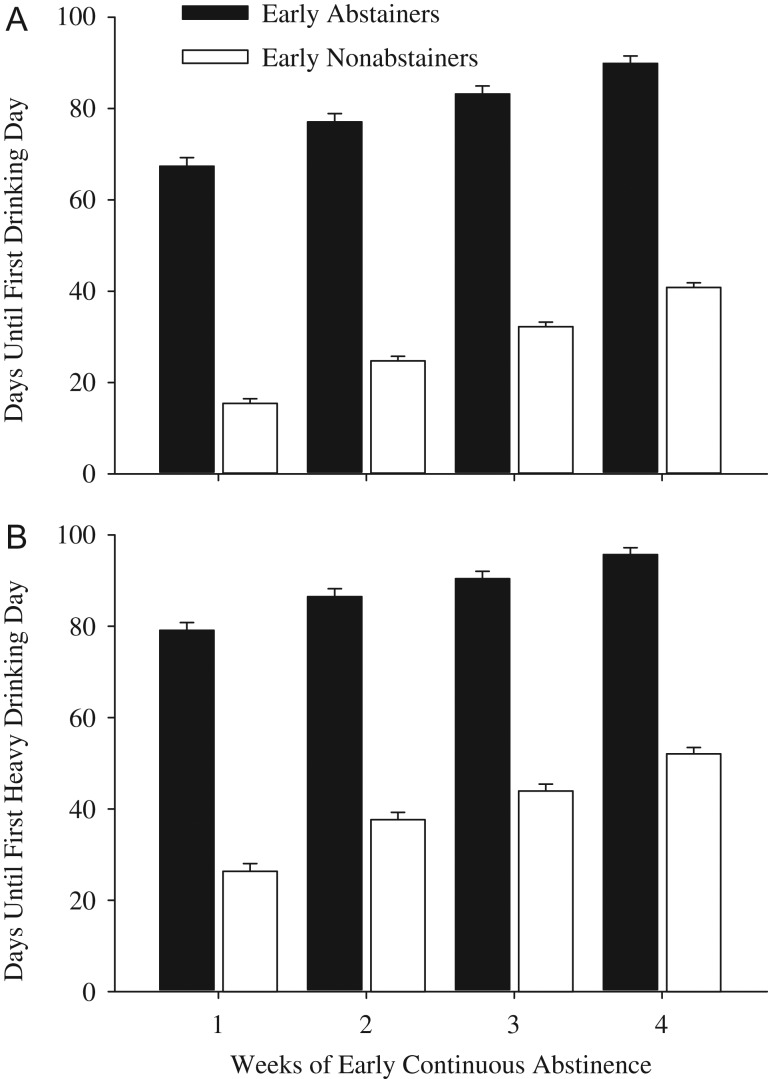
Fig. 1.
Values show mean days before first drinking (A) and first heavy drinking (B) day for the Early Abstainer (filled bars) and Early Nonabstainer (open bars) groups. Error bars represent standard error of the mean. X-axis represents duration of early abstinence; the Early Abstainer group contains all participants who were continuously abstinent for the duration of interest (1–4 weeks). All comparisons are statistically significant at P < 0.001 (Table 2).

