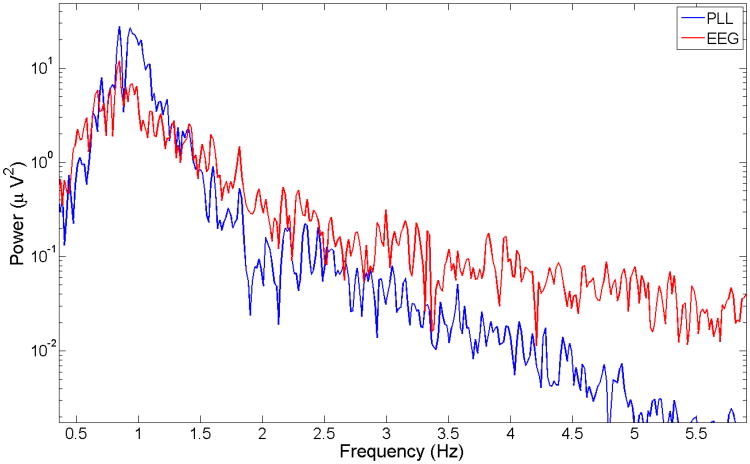
Fig. 11.
Spectrum of the EEG and the PLL (subject 4 data), showing that the EEG is a narrow-band process during SWS but the PLL is further narrowed around 1 Hz. This graph illustrates that range of sensitivity of the PLL, at frequencies above 3Hz the PLL has much less power than the EEG spectrum so it is not useful to track oscillatory processes above this frequency.

