
Fig. 13.
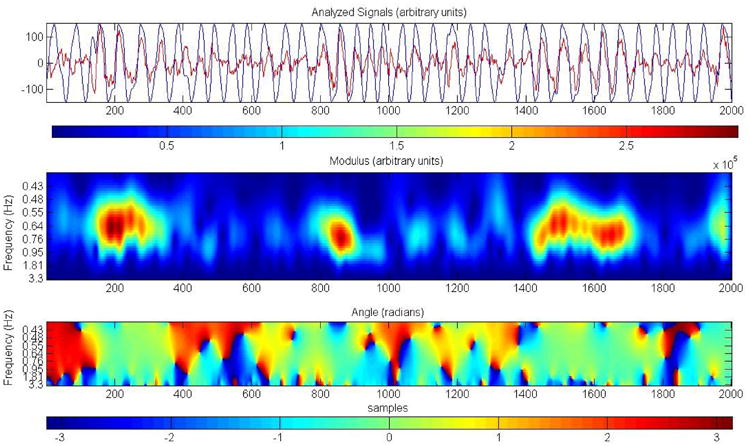
Wavelet coherence of the PLL and the EEG trace. The top panel shows the two traces, EEG (red) and PLL (black), data from subject 4 nap. The middle panel shows the coherence between the two times series. The colors represent wavelet energy with hot colors indicating higher coherence. The bottom panel shows the value of the phase difference in radians. During slow-wave bursts the amplitude coherence reaches values close to 1. The phase is close to zero in the presence of slow-waves bursts, when the PLL is locked. The scale range goes from 1 to 46 or 20 to 0.4 Hz, the center of the graph (where most of the high coherence values are observed) corresponds to 0.8 Hz.