
Fig. 8.
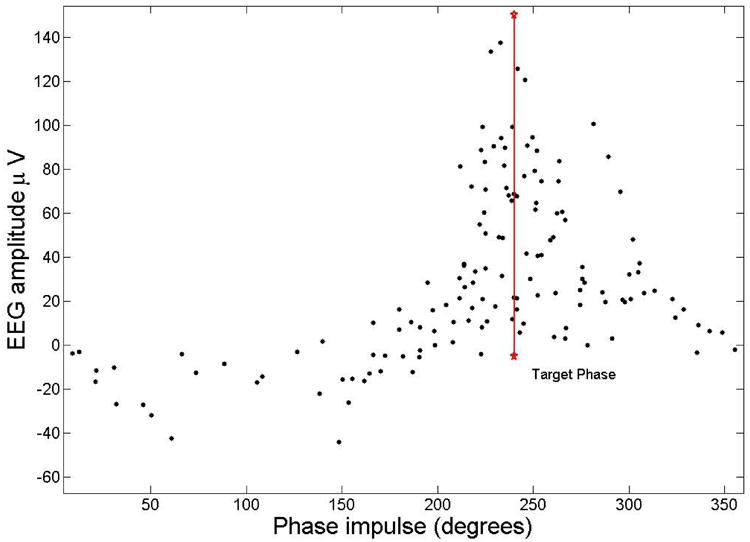
The amplitude of the EEG at the time of the acoustic impulse during SWS for subject 4 is shown as a function of phase. Most of the pulses (79%) where delivered between 180 and 360 degrees that corresponds to the up-state of the slow waves. As the amplitude becomes larger the phase of the impulse comes closer to the target phase of 240 degrees (shown as a red vertical line).