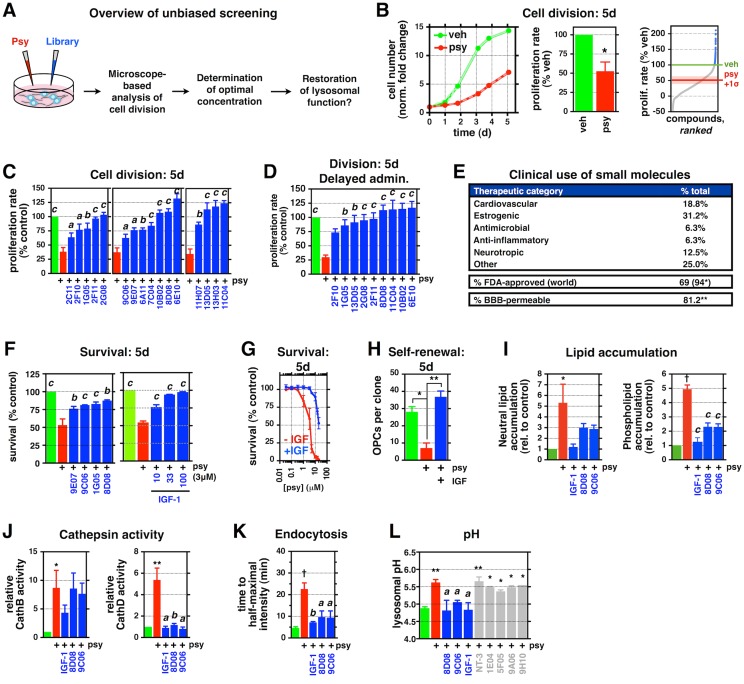
Fig 2. Unbiased screening identifies chemically diverse candidate protective agents that reduce Psy toxicities.
(A) Schematic depicting the work flow for unbiased screening with Celigo adherent cytometer (Nexcelom). (B) Representative plot of relative cell number over 5 d for rat O-2A/OPCs exposed to 1 μM Psy or vehicle (DMSO). Quantification of the relative proliferation rate for all 1,040 drugs at three concentrations over 5 d. Blue: “hit” drugs selected for further validation. A bar graph quantifying the relative proliferation rate of all vehicle and Psy controls is included. (C) Quantification of the relative proliferation rate of rat O-2A/OPCs exposed to 1.5 μM Psy, with and without verified pro-division “hits,” over 5 d. (D) Quantification as in (C) for cells exposed to Psy 48 h before exposure to the indicated drugs. (E) Summary of clinical metadata for lead “hits” as % of total. (* worldwide approval, including FDA. ** reported blood–brain barrier permeability; not all drugs have been examined/reported.) (F) Quantification of cell survival in cells exposed to 3.3 μM Psy for 5 d, with and without the indicated drugs, for 5 d. (G, H) Quantification of the (G) relative survival and (H) number of rat O-2A/OPCs per clone exposed to of Psy (1 μM in H), with and without 100 ng/mL insulin-like growth factor (IGF-1), for 5 d. (I–K) Quantification of (I) neutral lipid and phospholipid accumulation, (J) cathepsin B and D activities in rat O-2A/OPCs exposed to the indicated drugs, with and without 1 μM Psy, and (K) time to half-maximal intensity for endocytosis of fluorescent nanobeads for (I) 2 d or (J, K) 24 h. (L) Quantification of lysosomal pH for rat O-2A/OPCs exposed to 1 μM Psy, with and without the indicated “hits” (blue) or “non-hits” (gray), for 24 h. NT-3: 10 ng/mL; 1E04: 5 μM; 5F05, 9A06, 9H10: 1 μM. ap < 0.05, bp < 0.01 versus Psy-only. Data for all graphs displayed as mean ± SEM; ns = not significant; *p < 0.05, **p < 0.01, †p < 0.001 versus untreated; ap < 0.05, bp < 0.01, cp < 0.001 versus Psy-only treatment. See also S2 Fig, S1 and S2 Tables for drug names and concentrations. Data presented in this figure can be found in S1 Data.

