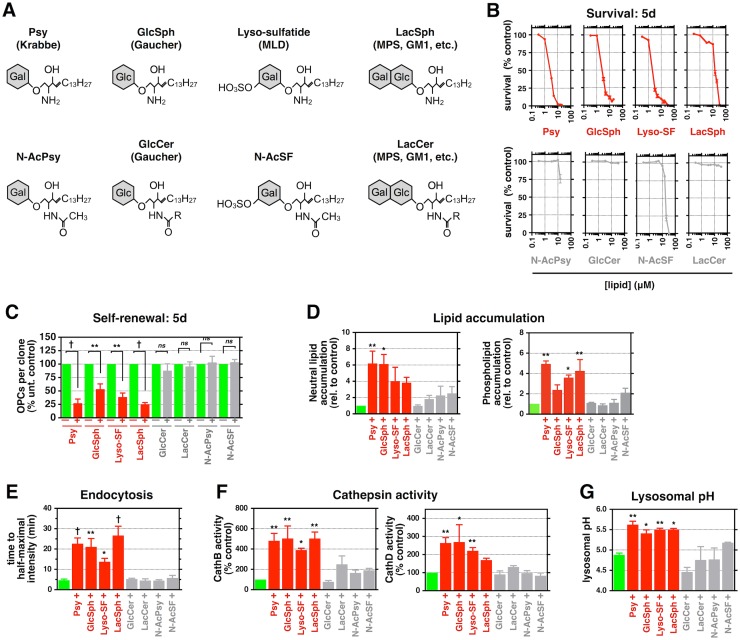
Fig 6. Lysosphingolipids accumulating in other LSDs suppress critical O-2A/OPC behaviors and lysosomal function.
(A) Chemical structures of the indicate lipids. Gal: galactose; Glc: glucose; R: variable hydrocarbon chain. (B–G) Quantification of (B) the relative survival, (C) the relative number of O-2A/OPCs per clone, (D) lipid accumulation, (E) endocytic import time, (F) cathepsin activity, and (G) lysosomal pH in rat O-2A/OPCs exposed to the indicated lipids for (B and C) 5 d, (D, E, G) 24 h, or (F) 2 d. Data for all graphs displayed as mean ± SEM; ns = not significant; *p < 0.05, **p < 0.01, †p < 0.001 versus untreated, unless otherwise indicated. S4 Table for lipid concentrations used in (C–G). Data presented in this figure can be found in S1 Data.

