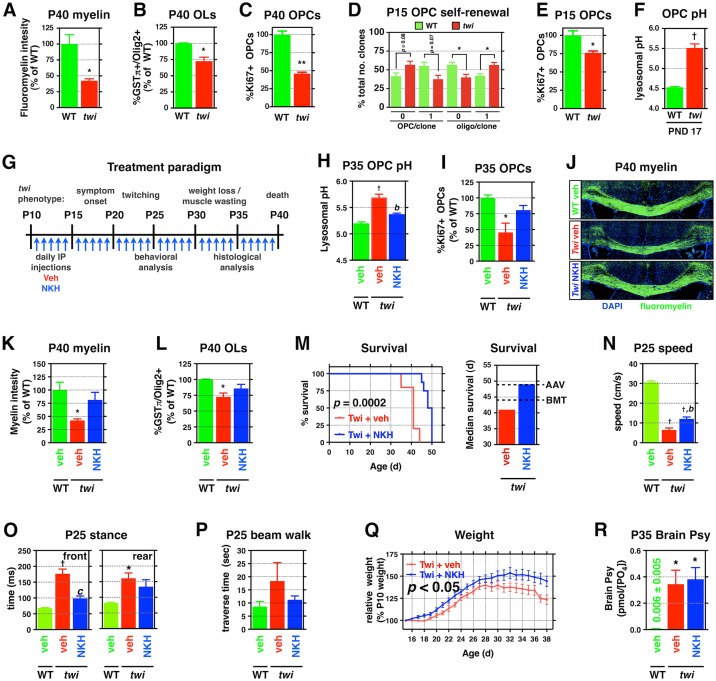
Fig 9. NKH-477, a protective compound identified in vitro, protects against multiple toxicities in treated twitcher mice.
(A–C) Quantification of (A) fluoromyelin intensity, (B) number of GSTpi+/Olig2+ OLs, and (C) the relative number of dividing Ki67+/Olig2+ O-2A/OPCs in the corpus callosa of P40 twitcher mice and age-matched WT littermates (n = 3 from different litters). (D) Analysis of clonal composition of P15 twi O-2A/OPCs and WT littermates across 5d. (E) Quantification of the relative number of dividing Ki67+/Olig2+ O-2A/OPCs in the corpus callosa of P15 twitcher mice and age-matched WT littermates (n = 3 from different litters). (F) Quantification of lysosomal pH of O-2A/OPCs acutely isolated from P17 twitcher and WT mice. (G) Overview of treatment paradigm and clinical course for twitcher mice. (H) Quantification of lysosomal pH of O-2A/OPCs isolated from P35 treated mice. (I) Quantification of the number of dividing callosal O-2A/OPCs in P35 treated mice. (J–L) Representative confocal images of fluoromyelin-stained corpus callosa of the indicated treatment groups at P40, in addition to quantification of staining intensity and the number of OLs. (M) Kaplan–Meyer survival curve for treated and untreated twi mice. Median survival of twi mice, with dotted lines indicating reported median survival of single-therapy treatments [15]. (N–Q) Quantification of travel speed, stance time, beam traverse time, and relative weights for P25 saline-treated WT and twi, as well as NKH-477–treated twi, mice. (R) Quantification of brain Psy levels at P35. Data for all graphs displayed as mean ± SEM; ns = not significant; *p < 0.05, †p < 0.001 versus WT; bp < 0.01 versus vehicle-treated twi. Data presented in this figure can be found in S1 Data.

