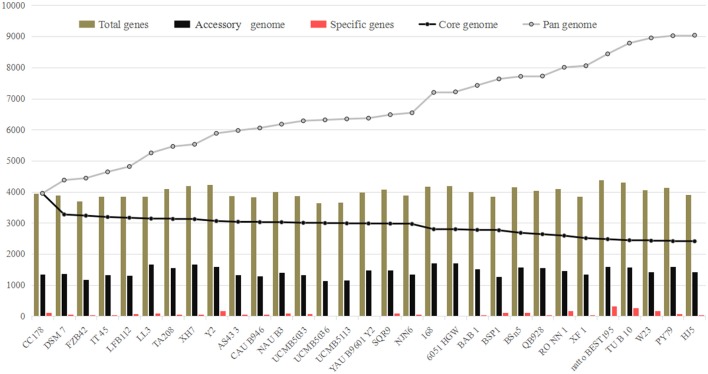
Figure 1.
Pan- and core-genome analysis of 18 Bacillus amyloliquefaciens and 13 B. subtilis strains. The lines in gray and black represent the pan- and core-genomes, respectively. The pan-genome increased with addition of new strains to the study (9037 OGs), while the core genome decreased at a slow rate with added strains (2409).

