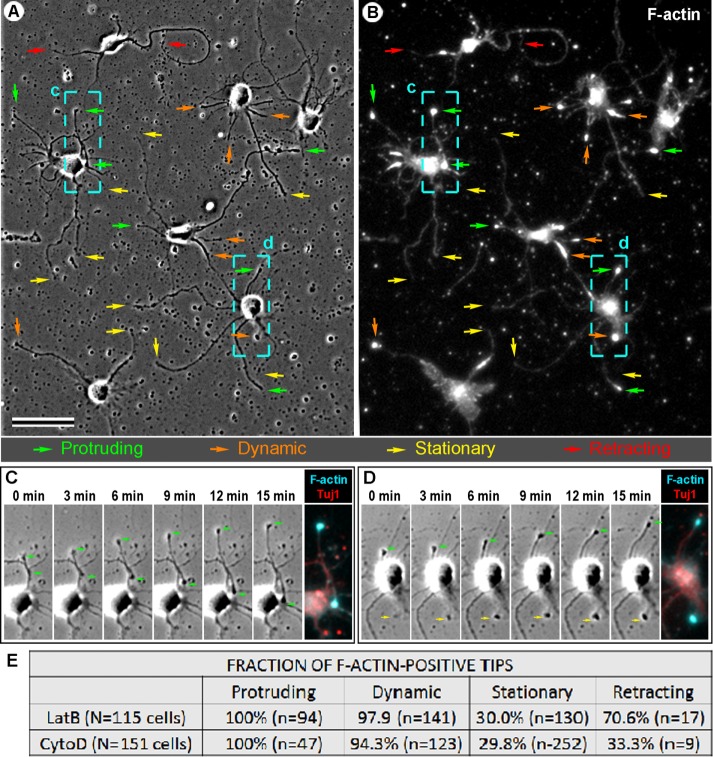
FIGURE 4:
Post hoc analysis of neurite outgrowth in the presence of LatB and CytoD. (A–D) Neurons treated with 1 μM LatB were recorded by phase contrast time-lapse microscopy for 15 min, fixed, and stained with phalloidin and Tuj1 antibody. (A) Last frame of the phase contrast sequence. (B) The same field as in A after staining with phalloidin. Colored arrows in A and B mark neurite tips that protruded (green), exhibited dynamic behavior without length changes (orange), remained stationary (yellow), or retracted (red) during time-lapse imaging. Bar, 50 μm. (C, D) Frames from the time-lapse sequence for the boxed regions c and d, respectively, labeled in A and B. Green arrows mark tips of elongating neurites. Rightmost images in C and D show post hoc staining of the same regions with phalloidin (cyan) and Tuj1 antibody (red). (E) Quantification of neurite behavior in post hoc experiments after treatment with various concentrations of LatB and CytoD. N, number of cells analyzed; n, number of neurites. Data show cumulative percentages of F-actin–positive neurite tips for each drug. Concentrations used: 1 μM LatB (N = 10; n = 286); 2.5 μM LatB (N = 1; n = 11); 5 μM LatB (N = 2, n = 31); 10 μM LatB (N = 3, n = 54); 1 μM CytoD (N = 14, n = 378); 2 μM CytoD (N = 1, n = 21), 2.5 μM CytoD (N = 1, n = 5); 5 μM CytoD (N = 2, n = 21); and 10 μM CytoD (N = 1, n = 6).

