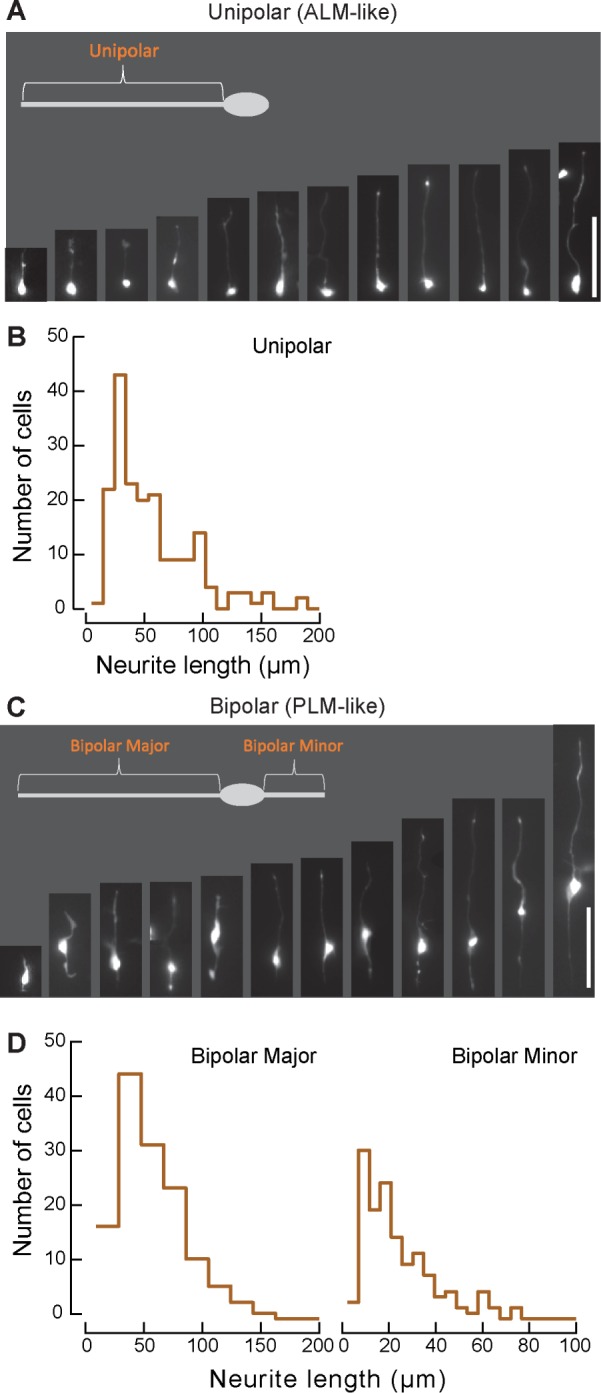
FIGURE 5:

TRNs adopt similar morphologies in vitro as they do in vivo. (A, C) Example images of unipolar and bipolar cells in culture. Processes are described as unipolar for the single process on unipolar cells, as bipolar major for the large process on bipolar cells, and as bipolar minor for the small process. Scale bars, 50 μm. (B, D) Histograms of process lengths for (B) unipolar and (D) major bipolar and minor bipolar cells. Bin sizes were determined as in Shimazaki and Shinomoto (2007).
